How intelligent, multi-sensor plant monitoring uses data from several sources to detect anomalies and alert operational teams before potential issues become real problems.
The previous blog in this series looked at the benefits and potential applications of intelligent plant monitoring and anomaly detection with just a single sensor involved.
The realty of many continuous chemical processes, though, is that detecting anomalies or deviations in their data often requires monitoring of more than one sensor.
In this chapter, we look at:
- How multi-sensor anomaly detection works
- Detection of anomalies in sensor groups
-
A practical example of compressor temperature monitoring
Multi-sensor monitoring and anomaly detection
As the name suggests, multi-sensor monitoring combines groups of sensor signals rather than just drawing on information from a single sensor. This benefits of this approach include:
- It helps to identify malfunctional pattern combinations not visible with single sensors alone
- It provides plant teams with combined detection and aggregated anomaly information
Figure 1 shows how the single sensor approach outlined in the previous blog is expanded to detect anomalies across multiple sensor signals.
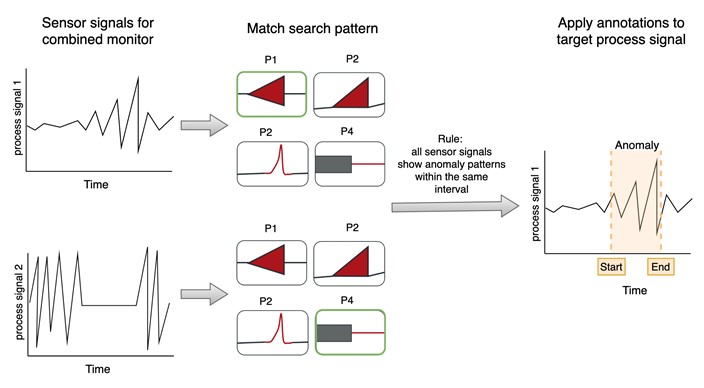
Figure 1: Multi-sensor anomaly detection. Here, two sensor signals are monitored continuously. Two anomalous patterns are detected in each signal, allowing the final anomaly to be annotated
Multi-sensor monitoring in practice
Let’s look at a real-world scenario. Figure 2 shows the product density measurements for one product over a single week. The measurements are used to calculate real-time yield, a core process KPI for the plant. Its team recognized from time to time unnaturally high yield values in its chemical conversion process.
By taking multiple sensor signals into account, Navigance analysis revealed the density measurements suffered from strong peaks. These resulted from a sensor malfunction when the plant switched to a certain operational condition. Traditional remedies to avoid the malfunction, such as replacement parts, were unable to ensure consistent and reliable measurements.
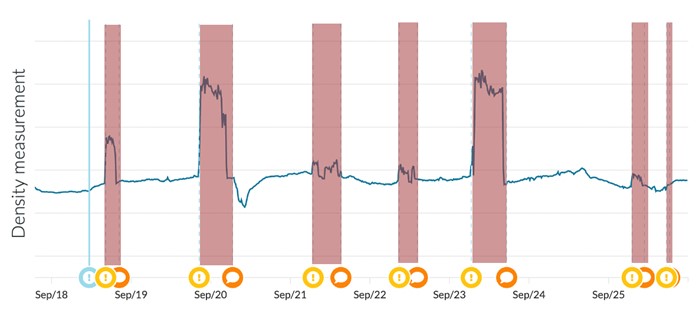
Figure 2: Multi-sensor detection: identifying anomalies in density measurements using multiple sensor signals beyond density alone.
Detecting inconsistencies in sensor groups
Another approach Navigance takes is to monitor metric group consistency. Rather than searching for malfunctional patterns, this method involves learning the relationship between metrics within a defined sensor group.
This makes it robust against strong fluctuations and changes the group experiences while ever all metrics behave consistently. However, if a single metric exhibits strong fluctuations, the relevant time interval is marked as anomalous.
Figure 3 illustrates the underlying idea. Anomalous behavior in a single signal represents a suspicious trend that should be better understood. This would be important to analyze such behaviors in, for instance, temperature field sensors used in any equipment or catalyst bed.
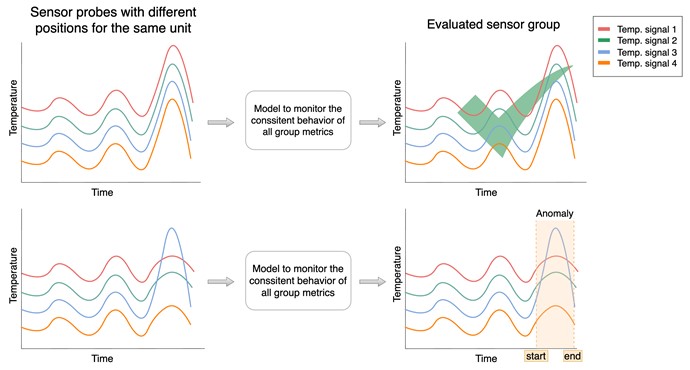
Figure 3: Sensor group consistency monitoring showing two scenarios. While the upper example shows strong fluctuations, all signals in the group remain consistent. In the lower example, one signal shows strong fluctuations compared with the rest of the group, so is marked as an anomaly.
Detecting inconsistencies in multiple temperature sensors
How does this work in practice? Let’s go back to the example of compressor monitoring but look at how inconsistencies are detected between multiple sensor signals.
To keep compressors working reliably, different sensors are regularly used to monitor their temperature and spot anomalies, which may indicate cooling failures, leakages, or other issues within the unit.
Taken together, these temperature sensors constitute a temperature field, which can be monitored as one group of measurements with a correlated trend. Any sudden break from this correlation may be regarded as anomalous behavior.
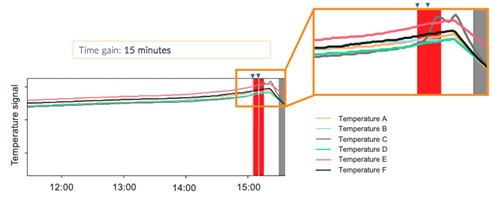
Figure 4: Sensor consistency monitoring for compressor temperature sensors. An inconsistency is developing in temperature C, which triggers alerts 15 minutes before emergency shutdown (marked in red).
In the example of a syngas compressor shown in Figure 4, an anomaly detected by the Navigance Plant Monitor triggered an alert 15 minutes before the temperature excursion led to a plant-wide trip and/or unplanned shutdown.
Analysis of the compressor during repair revealed its compressor cooling failed at one piston section, matching the inconsistency that developed in Temperature C’s readings.
While a 15-minute time window may not totally prevent an unplanned shutdown, it does enable operators to initiate a reduction in capacity or controlled shutdown of the reactor and equipment, reducing stress on the plant equipment.
Summary
In this and our previous articles we’ve looked at the methods of anomaly detection deployed by the Navigance Plant Monitor to help plant teams spot issues and deviations in the patterns of their plant data. These techniques allow plant personnel to be alerted early to anomalies that may warrant their attention and remedial action – potentially weeks or months in advance. This proactive alerting allows them to intervene before these issues ever become problems.
Do some of the use cases for these detection methods outlined here sound familiar from your own chemical plant? Are ensuring high availability and minimizing the cost of unplanned downtime key priorities? Do you feel you could benefit from the Navigance Plant Monitor too?
Talk to us about a tailored Plant Monitor deployment to suit your own monitoring and availability objectives. You can also request a benefit assessment.
Read the other articles in this series:
Use cases: single-sensor anomaly detection
Don't miss out on new articles.
Explore further:
Whitepaper: Advance with intelligence
AI-enabled data analysis unlocks hidden process optimization potential, effortlessly and without tying up your resources. Our free white paper reveals where to start.
Whether you’re responsible for operating a chemical plant, part of the engineering team that keeps it up and running, or you oversee the commercial aspects of its wider business, one thing is increasingly certain: you need to digitalize sooner or later.
Read more